
Lean Wiki
What is a Matrix Plot? An Introduction from Leanscape
A matrix plot is a type of chart that allows you to visualize data in a matrix format. Typically, a

A matrix plot is a type of chart that allows you to visualize data in a matrix format. Typically, a
A Kruskal-Wallis Test compares the medians of two or more groups. It is a nonparametric alternative to the ANOVA which

The Johnson Transformation is a mathematical transformation used to create new
Hypothesis testing can help! With hypothesis testing, business professionals are empowered with actionable insights that

The Lean House of Quality (HoQ) is a tool that project managers can use to assess the progress of a

A histogram is a graphical representation of data that shows how often each value occurs. It is used to summarize

The quality of measurement data is essential for making sound decisions in product development and manufacturing. To ensure data quality,

The Design of Experiments, otherwise known as DOE, is a statistical approach used to identify the factors that impact the

A fishbone diagram, also known as a cause and effect diagram or Ishikawa diagram, is a visualisation tool used to

Lean Six Sigma is a problem-solving approach that can be used to improve performance
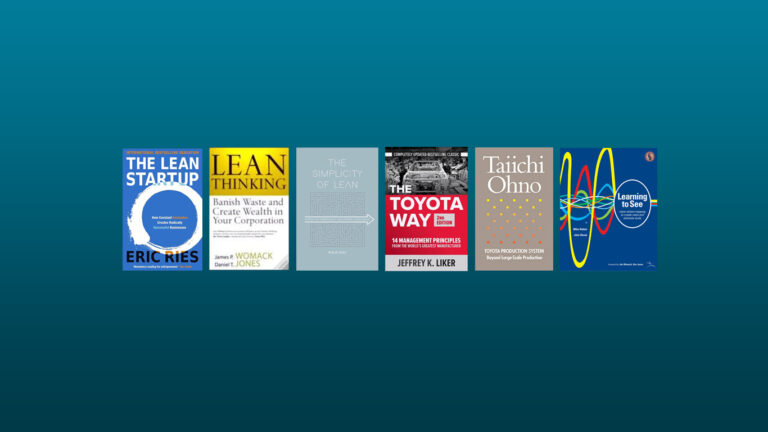
Our selection of the best books about Lean. We continually delve into the world of Lean but finding

Jidoka is an integral part of Lean principles that focuses on optimizing the flow of production processes. It plays a

Finding the best Lean Six Sigma Certification program can be quite a daunting task at first but it is not

Are you looking for a way to increase the productivity of your business? By applying Lean principles to workplace organisation,

Many executives face the challenge of knowing that there is a problem, but their organization lacks the talent or numbers

“Make a continuous process flow to surface issues” A great example of the difference between batch and lean flow is

The Pull Principle embodies the philosophy of producing only what is necessary, when it is necessary, and in the amount

Heijunka, a cornerstone concept in the Lean Six Sigma methodology, centres around the idea of levelling production to create a

A matrix plot is a type of chart that allows you to visualize data in a matrix format. Typically, a

A Kruskal-Wallis Test compares the medians of two or more groups. It is a nonparametric alternative to the ANOVA which

The Johnson Transformation is a mathematical transformation used to create new variables from existing variables. It is named after its inventor, British statistician Norman Lloyd Johnson. The Johnson Transformation can be used to linearise nonlinear relationships and to create normally distributed variables from non-normal ones.

Hypothesis testing can help! With hypothesis testing, business professionals are empowered with actionable insights that drive their decision-making process. This article will introduce you to the important concepts of hypothesis testing and offer key tips for leveraging it in making informed decisions for your business. From defining a null and alternative hypothesis to understanding p-values, this informative piece will equip you with the knowledge necessary for the efficient and effective evaluation of data derived from experiments

The Lean House of Quality (HoQ) is a tool that project managers can use to assess the progress of a

A histogram is a graphical representation of data that shows how often each value occurs. It is used to summarize

The quality of measurement data is essential for making sound decisions in product development and manufacturing. To ensure data quality,

The Design of Experiments, otherwise known as DOE, is a statistical approach used to identify the factors that impact the


A fishbone diagram, also known as a cause and effect diagram or Ishikawa diagram, is a visualisation tool used to
Lean Six Sigma is a problem-solving approach that can be used to improve performance
Our selection of the best books about Lean. We continually delve into the world of Lean but finding
Jidoka is an integral part of Lean principles that focuses on optimizing the flow of production processes. It plays a
Finding the best Lean Six Sigma Certification program can be quite a daunting task at first but it is not
Are you looking for a way to increase the productivity of your business? By applying Lean principles to workplace organisation,
Many executives face the challenge of knowing that there is a problem, but their organization lacks the talent or numbers
“Make a continuous process flow to surface issues” A great example of the difference between batch and lean flow is
The Pull Principle embodies the philosophy of producing only what is necessary, when it is necessary, and in the amount
Heijunka, a cornerstone concept in the Lean Six Sigma methodology, centres around the idea of levelling production to create a
