A fishbone diagram, also known as a cause and effect diagram or Ishikawa diagram, is a visualisation tool used to identify the potential causes of a problem.
Fishbone diagrams are used in quality management and Lean Six Sigma methodologies to analyse process inputs and outputs and identify improvement areas. In this post, we’ll discuss the components of a fishbone diagram and how to use it to improve your processes.
How to Use a Fishbone Diagram
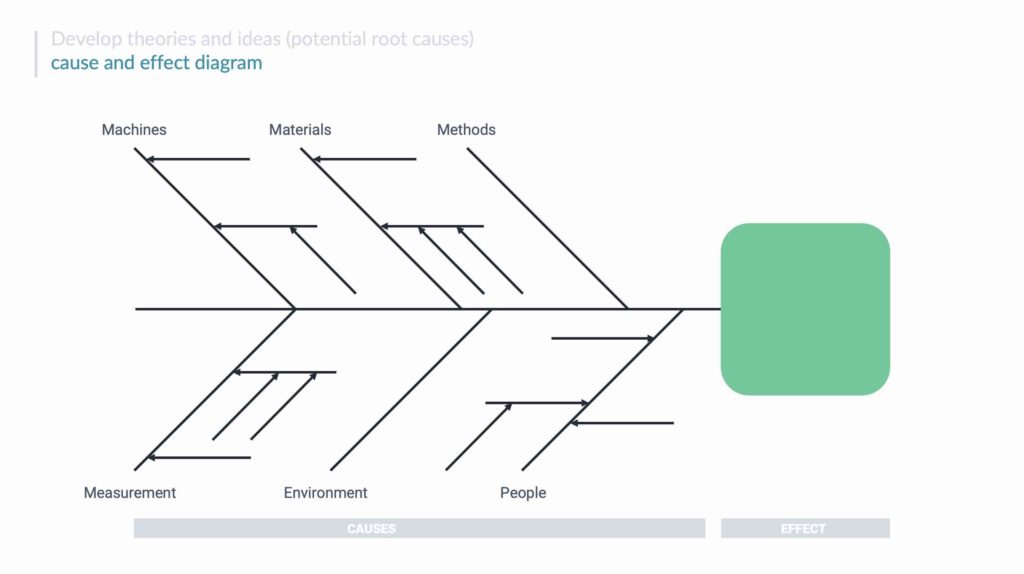
Fishbone diagrams are used to identify the potential causes of a problem. To create a fishbone diagram, start by identifying the problem. Then, list out the possible causes of that problem. Finally, categorise those causes into designated categories – often called the 6Ms – if you rename Environment to Mother Nature.
- Methods
- Machines (equipment)
- People (manpower)
- Materials
- Measurement
- Environment
Once you have your potential causes categorised, you can start identifying relationships between those causes. For example, if you’re trying to troubleshoot a problem with your sales process, you might notice that several potential causes fall under the category of “People.” By identifying these relationships, you can narrow your search for the root cause of the problem.
Here is an example of a Fishbone Diagram
When to Use a Fishbone Diagram
Fishbone diagrams are most commonly used in manufacturing and service industries. However, they can be used in any industry or business context where there is a need to identify improvements or optimise processes. The goal is to use the fishbone diagram for root cause analysis.
Some common examples of when to use a fishbone diagram include:
– When launching a new product or service
– When trying to improve an existing product or service
– When investigating customer complaints
– When analysing data to find trends
– When brainstorming ideas for process improvement
In summary:
So if you are trying to improve a process or product can be difficult, but with the right tools, it can be a lot easier.
The fishbone diagram, also known as the cause and effect diagram or Ishikawa diagram, is one of the most popular visualization tools used for problem-solving
The fishbone diagram is easy to use and can help you quickly identify the root cause of a problem.
Conclusion:
A fishbone diagram is a powerful tool that can be used in many different business contexts. By visualising the potential causes of a problem, you can more easily identify relationships between those causes and isolate the root cause of the problem. The next time you’re faced with a business problem, try using a fishbone diagram to help you troubleshoot and find solutions.