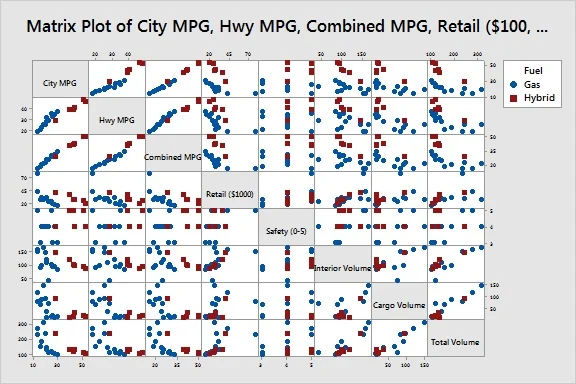
A matrix plot is a type of chart that allows you to visualize data in a matrix format. Typically, a matrix plot will have numerical values on both the x- and y-axes, with the z-axis being used to represent the value of each point in the matrix. Matrix plots can be used to visualize any data that can be expressed in a matrix format, including correlation matrices, distance matrices, and heat maps.
Matrix plots produce an array of Scatter plots for several columns of data. Potential correlations can then be identified visually.
Matrix of plots
This type of matrix plot accepts up to 20 variables and creates a plot for every possible combination. A matrix of plots is effective when you have many variables and you would like to see relationships among pairs of variables.
For example, a business analyst creates a matrix of plots to explore the relationships between several business metrics. The plot shows every combination of a number of clients, rate of return, and a number of years in business.
How to create a Matrix Plot
There are many different ways to create a matrix plot, but the most common method is to use a scatter plot. To create a scatter plot, you will need to have three columns of data: one for the x-axis, one for the y-axis, and one for the z-axis. Each row of data will then correspond to a point in the matrix.
Once you have your data, you can start creating your matrix plot. Many different software packages will allow you to do this, but for this example, we will use Excel. First, open up Excel and create three columns for your x-axis, y-axis, and z-axis data. Then, enter your data into each column.
Next, select all of your data and go to the Insert tab. From here, select Scatter and then choose Scatter with Straight Lines. This will create a basic matrix plot using your data. You can then customize your plot by adding titles, labels, grids, etc.
So, you have some data that you want to visualize in a matrix format, but don’t know how to get started.
Many different software packages allow you to create matrix plots, but they can be challenging to use if you’re unfamiliar with them.
Minitab is a software package that allows you to create matrix plots easily. First, open up Minitab and select the Stat & Matrix Plot menu option. This will open up a new window where you can enter your data
Next, select the type of plot you want to create. For this example, we will use a scatter plot. Then, select the columns for your x-axis, y-axis, and z-axis data. Finally, click on the OK button and Minitab will create your matrix plot. You can then customize your plot by adding titles, labels, grids, etc.
Conclusion:
Matrix plots are a great way to visualize data in a matrix format. You can easily create a matrix plot in Excel using a scatter plot. Once you have your basic plot made, you can then customize it by adding titles, labels, grids, etc.


