A Gantt Chart: the compass that guides you through the labyrinth of project management, illuminating your path towards project success.
Challenges in project management
Project management is fraught with challenges. One common issue is the lack of clear communication, which can lead to misunderstandings, missed deadlines, and conflict within the team. Another obstacle is scope creep, the gradual expansion of the project’s objectives and deliverables beyond its original goals, often leading to delays and cost overruns. Additionally, resource allocation can also pose a significant challenge. Ensuring that team members, materials, and budgets are used efficiently and effectively requires careful planning and ongoing management. Lastly, risk management is another critical challenge, as unforeseen circumstances can throw a wrench into even the most well-planned projects.
What is a Gantt chart?
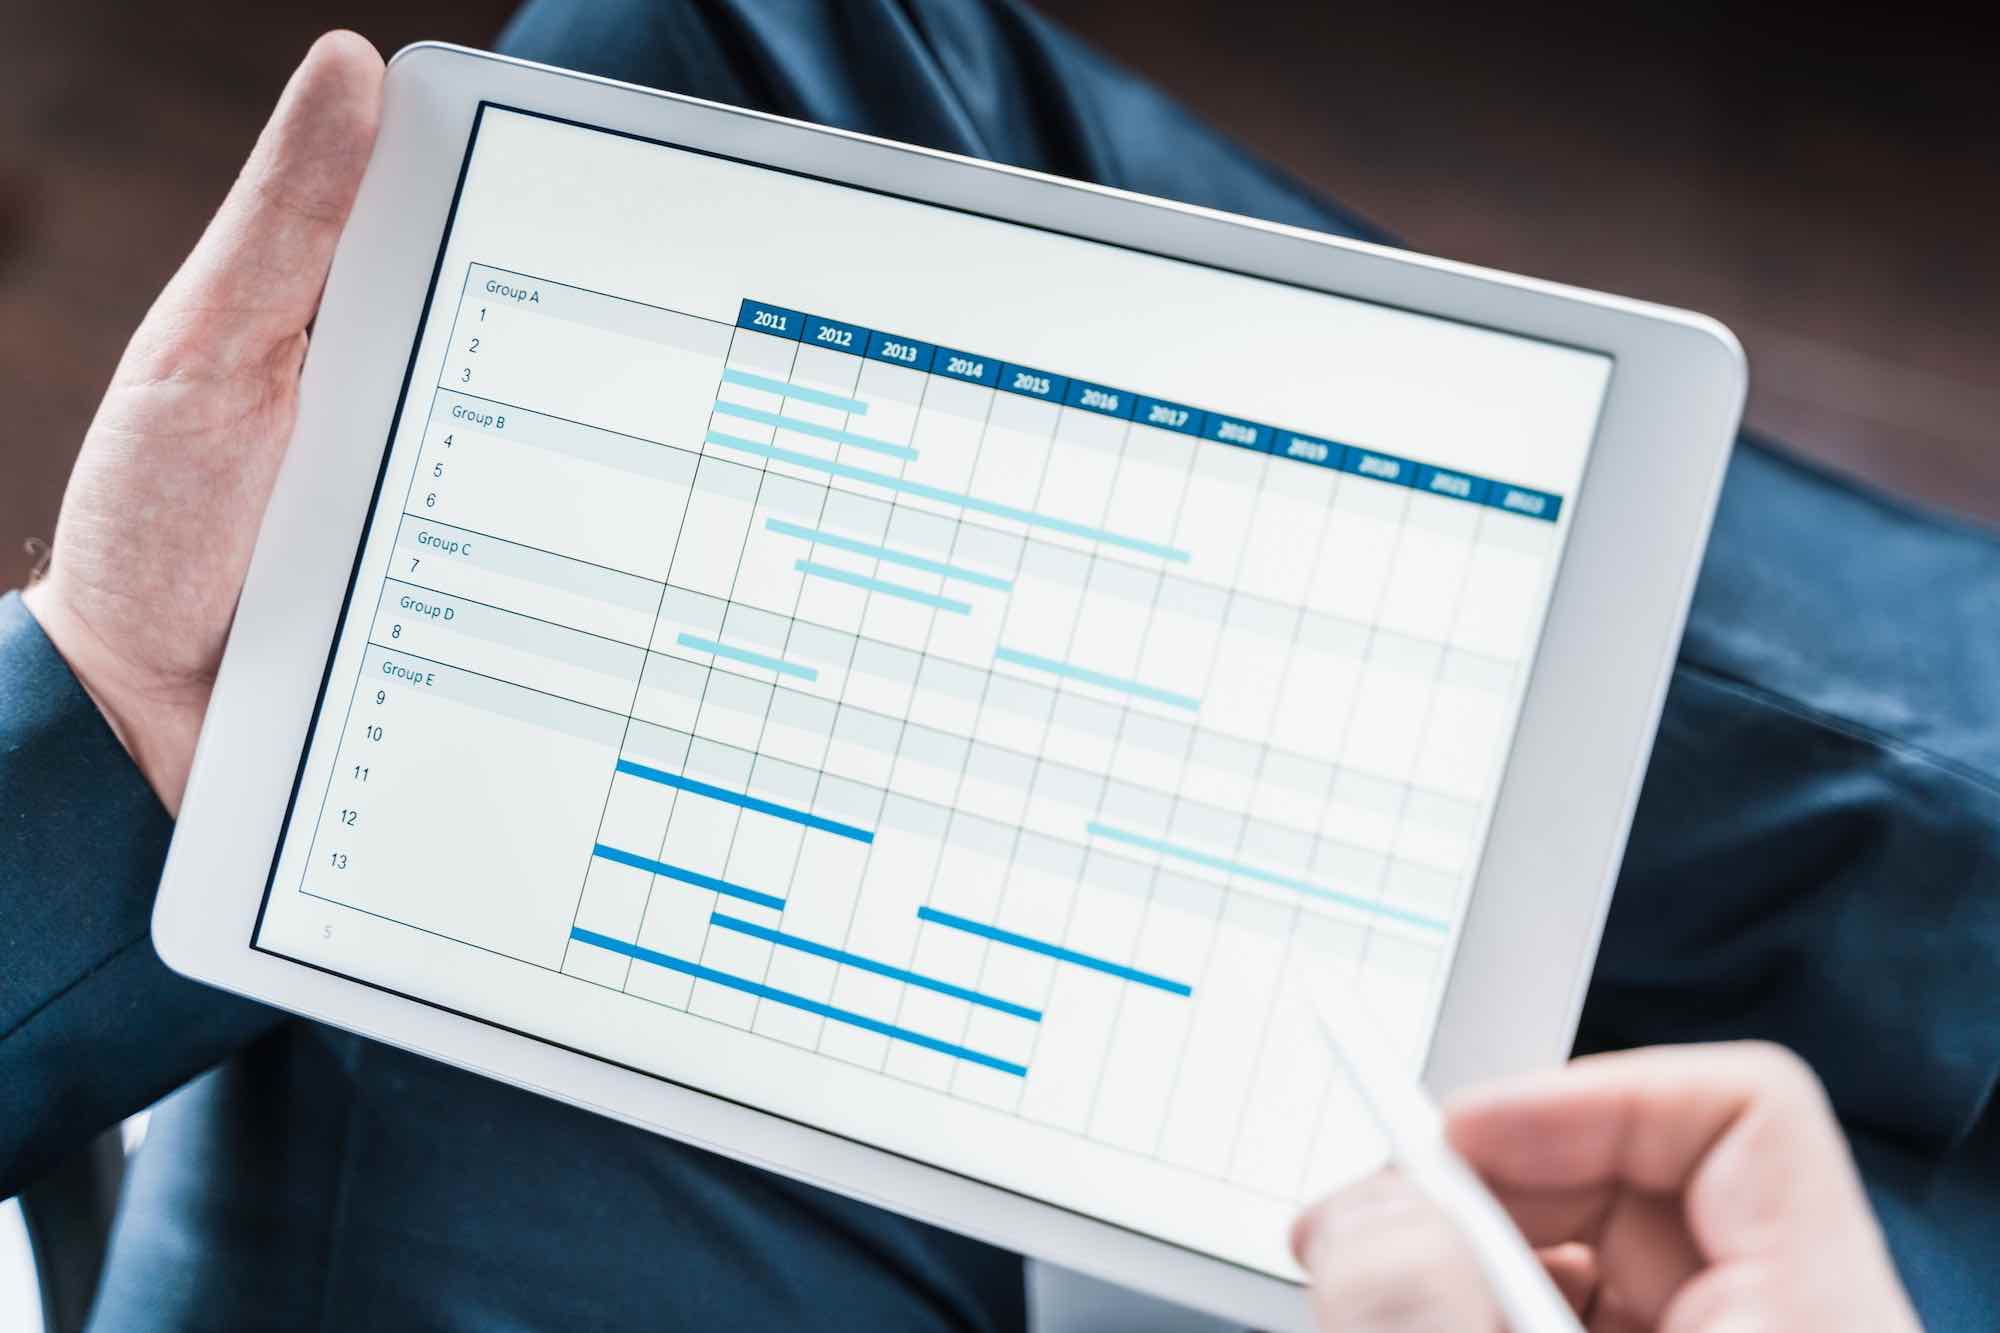
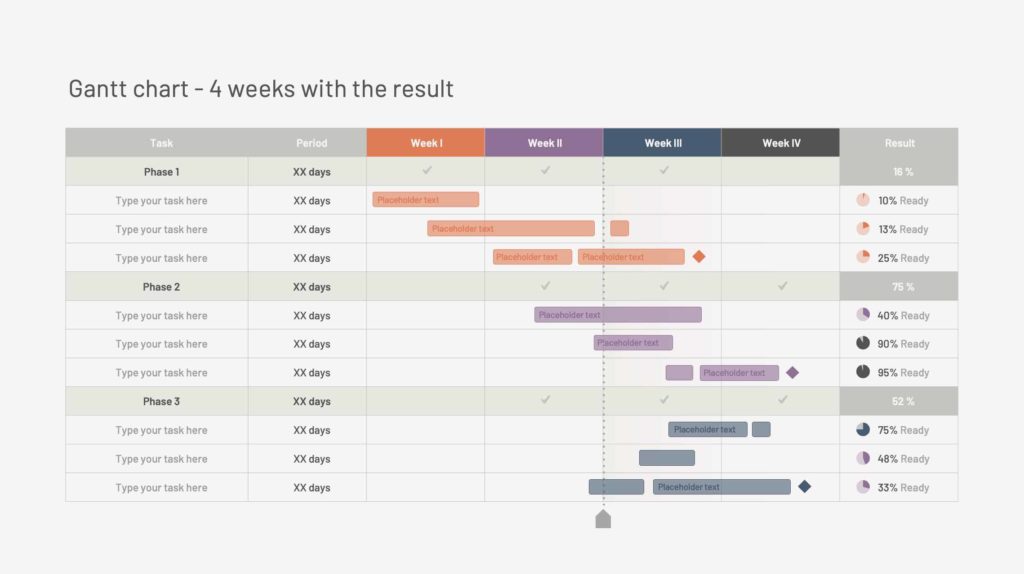
A Gantt chart is a visual representation of a project schedule, named after its inventor, Henry Gantt. This type of chart is an invaluable tool in project management, as it effectively illustrates the start and end times of the various tasks and phases of a project. Tasks are typically displayed as horizontal bars along a timeline. The length of each bar corresponds to the duration of the task it represents. What makes a Gantt chart particularly useful is their ability to show the dependency relationships between tasks, giving a clear view of the order in which tasks need to be completed. They offer a straightforward and intuitive way to see at a glance what needs to be done, by whom, and by when, making them an essential tool for successful project planning and execution.
Benefits of using a Gantt chart in project management
A Gantt chart provide numerous benefits in project management, making them a vital tool for any project manager.
- Visual Clarity: Gantt charts present complex information in a format that is easy to understand. This helps to provide a clear picture of the project’s progress at a glance.
- Improved Communication: By visualising the tasks, their sequence, and their deadlines, Gantt charts promote better communication among team members. Everyone knows what’s expected of them and when.
- Efficient Resource Management: A Gantt chart aids in resource allocation, making it easier to see which tasks are resource-intensive and ensuring resources are utilised effectively.
- Better Coordination: By showing dependencies between tasks, a Gantt chart helps in coordinating different parts of the project, preventing conflicts and redundancies.
- Keeps Everyone on Track: Lastly, a Gantt chart helps keep the project on track. They make it easier to identify delays or issues and make necessary adjustments before they affect the overall project timeline.
In summary, a Gantt chart is an effective tool for managing projects, improving communication, coordination, and resource allocation, and keeping everyone on track. So, the next time you embark on a project, consider using a Gantt chart to guide you from chaos to clarity.
How to create a Gantt chart
Creating a Gantt chart involves a few straightforward steps:
- Identify Tasks: The first step to creating a Gantt chart is to identify all the necessary tasks required to complete the project. It’s essential to be comprehensive and include all the tasks, no matter how small.
- Sequence Tasks: Once you have identified all the tasks, they need to be sequenced. Determine the order in which the tasks must be completed, and identify any dependencies between tasks.
- Assign Dates: The next step is to assign the start and end dates for each task. The length of the bar in the Gantt chart will represent this duration.
- Allocate Resources: Subsequently, allocate resources for each task. Resources could be team members, equipment, or other materials required for the completion of the tasks.
- Create the Gantt Chart: Use a project management tool or software that supports a Gantt chart to create the chart. Add all the tasks, their sequence, assigned dates, and resources. Most software will generate the Gantt chart for you.
- Update and Review Regularly: Lastly, it’s crucial to keep the chart updated and review it regularly. This will help you track progress, identify potential issues early, and make necessary adjustments to keep the project on track.
Remember, a Gantt chart is a living document that should adapt with the project, reflecting changes in tasks, timelines, or resources as they happen.
Tips for effectively using a Gantt chart
While a Gantt chart is an incredibly useful tool, their effectiveness depends on how well they are used. Here are some tips to get the most out of your Gantt chart:
- Keep It Simple: Don’t overload your Gantt chart with too many tasks. Keep it simple and meaningful by including only those tasks that are crucial to the project.
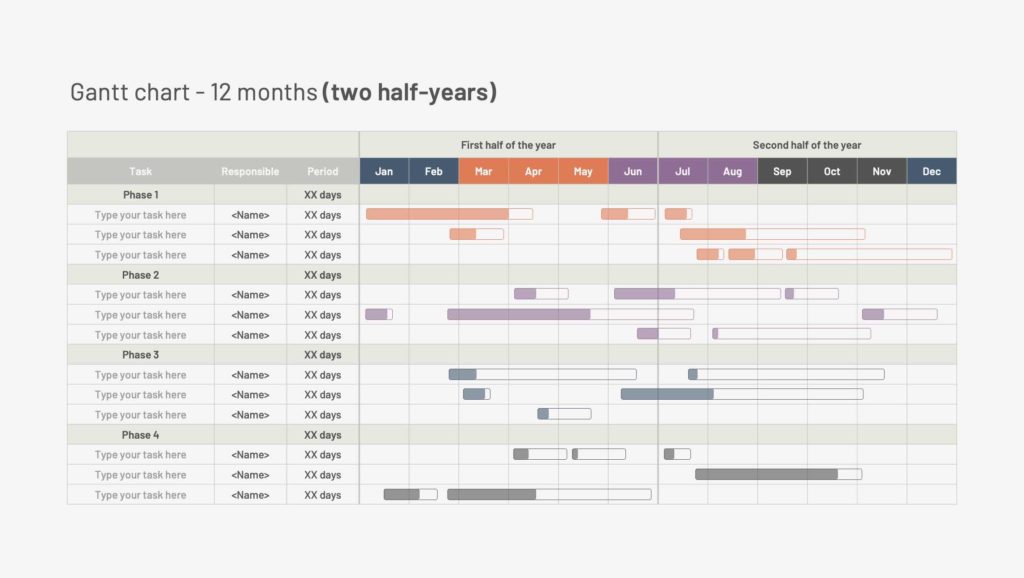
- Use Colours: Use colours to differentiate between different types of tasks or different team members. This can make the chart easier to read and understand.
- Review Regularly: Make sure to review and update your Gantt chart regularly. This will help you stay on top of any changes or delays and adjust the project timeline as needed.
- Share the Chart: Share the Gantt chart with your team members and stakeholders. This enhances transparency and keeps everyone informed about the project’s status.
- Use Software: There are many project management tools available that can help you create and manage Gantt charts. These tools often come with additional features such as notifications and collaboration tools that can further improve project management.
By following these tips, you can harness the full power of Gantt charts to streamline your project management and lead your projects from chaos to clarity.
Myriad software and tools available in the market
Myriad software and tools available in the market can assist in creating and managing a Gantt chart. Here are a few noteworthy ones:
Microsoft Project: This is a robust project management tool that features comprehensive Gantt chart capabilities, allowing for task sequencing, resources allocation, and progress tracking.
Smartsheet: Known for its flexibility, Smartsheet provides interactive Gantt charts that can be easily updated and shared with teams and stakeholders.
Asana: Asana is a project management tool that offers a simple and user-friendly interface for creating a Gantt chart, called ‘Timeline view’ in the platform.
Trello: Trello uses a plugin called ‘Big Picture’ to provide Gantt chart functionality. This tool is ideal for smaller, less complex projects.
GanttPRO: As the name suggests, GanttPRO is dedicated to Gantt charts. It provides an intuitive interface and a multitude of features tailored for Gantt chart creation and management.
Each of these tools has unique strengths and is suited to different projects. By choosing the right tool for your needs, you can take full advantage of the benefits of a Gantt chart for project management.
Case studies: Real-life examples of using a Gantt charts in project management
Case Study 1: Construction Project
A construction company was tasked with building a residential complex within a year. To manage this large project, they decided to use a Gantt chart. The chart helped the team visualise the entire project, from groundwork to finishing touches. It outlined the sequence of tasks, showing that the foundation needed to be laid before the walls could be built. The Gantt chart also displayed the dependencies between tasks. For instance, the electrical work could not start until the walls were up. Using the Gantt chart, the project stayed on track, and the residential complex was completed within the given timeframe.
Case Study 2: Software Development Project
In a software development company, a team was working on launching a new app. The project manager used a Gantt chart to plan and coordinate the project. The team could see when the design phase needed to be completed to start with the coding. The dependencies between tasks were clear, for instance, bug testing could only occur after the initial coding was finished. The Gantt chart also helped in resource allocation, identifying which team members were available for each task. Thanks to the Gantt chart, the app was developed efficiently and launched on schedule.
These real-life examples show how Gantt charts can be used effectively in diverse fields for project management, from construction to software development, aiding in keeping complex projects on track.
When do you use Gantt Charts in Lean Six Sigma Projects?
In Lean Six Sigma projects, Gantt charts are particularly beneficial during the Define, Measure, Analyse, Improve and Control (DMAIC) cycle. During the Define phase, a Gantt chart can help establish the project timeline, sequencing of tasks, and allocation of resources.
In the Measure phase, it assists in tracking the progress of data collection and analysis. As the project transitions into the Analyse phase, the chart serves as a visual guide to understand the sequence of analytical activities and their interdependencies.
In the Improve phase, a Gantt chart is crucial to manage the implementation of solutions and monitor their impact over time.
Finally, during the Control phase, the chart can aid in scheduling and tracking the regular audit tasks that ensure the implemented improvements are sustained. Thus, a Gantt chart acts as a critical tool in Lean Six Sigma projects, assisting in planning, monitoring, and communication throughout the project lifecycle.
Gantt charts in waterfall vs. agile planning
Gantt charts can indeed serve as a beneficial tool in both waterfall and agile planning methodologies due to their inherent flexibility and adaptability.
In a waterfall project management environment, tasks are sequential, with each stage contingent upon the completion of the previous one. Here, a Gantt chart’s linear structure and clear visual representation of task sequences and dependencies make it an ideal tool. It can effectively outline the entire project from start to finish, enabling project managers to establish a definite timeline and allocate resources appropriately.
Conversely, in an agile environment, where tasks are iterative and flexible, Gantt charts can still provide significant value. While tasks in agile projects aren’t strictly sequential as in waterfall, a Gantt chart can help visualise sprints or iterations, giving a general overview of the project timeline. It can also assist in tracking progress, identifying potential bottlenecks or overlaps, and ensuring optimal resource allocation.
Therefore, irrespective of the project management methodology employed, Gantt charts can contribute significantly to enhancing efficiency and ensuring seamless project execution.
What is the difference between a flowchart and a Gantt chart?
While both flowcharts and Gantt charts are valuable tools for project management, they serve different purposes and provide distinct views of the project.
A flowchart is a diagrammatic representation of an algorithm or a process. It illustrates the steps in a process and the decisions made along the way, with different shapes denoting different types of actions or steps. Flowcharts are particularly useful in understanding complex processes and identifying bottlenecks or areas of inefficiency. They do not typically include a timeline or provide information about the duration of tasks.
On the other hand, a Gantt chart is a type of bar chart that visualises a project schedule. It helps in planning, coordinating, and tracking specific tasks in a project. Unlike a flowchart, a Gantt chart includes a timeline, representing when each task should start and finish, the duration of each task, and the dependencies between tasks.
In essence, while a flowchart provides a process view, a Gantt chart offers a time view of a project. Both can be used together for comprehensive project management: a flowchart for outlining and understanding the process, and a Gantt chart for scheduling and tracking the tasks.
Training and resources for learning about Gantt charts
For those interested in mastering the use of Gantt charts, there are several resources available to deepen your understanding and enhance your skills:
Online Courses: Websites like Coursera and LinkedIn Learning offer comprehensive courses on project management where Gantt charts are extensively covered. These courses are typically designed by industry experts and provide both theoretical knowledge and practical applications.
Books: There are numerous books available that delve into the topic of Gantt charts and project management. “Project Management for Dummies” by Stanley E. Portny is one such book that provides a clear and concise introduction to Gantt charts.
Webinars and Tutorials: Websites like ProjectManager.com often host webinars and create video tutorials explaining the use of Gantt charts. These are particularly useful as they often include real-time demonstrations of creating and managing Gantt charts.
Leanscapes Lean Six Sigma Yellow Belt Training: Leanscapes offers a Lean Six Sigma Yellow Belt training programme that covers various aspects of project management, including the use of Gantt charts. This course is highly recommended for beginners as it provides foundational knowledge of Lean and Six Sigma methodologies and how they can be integrated with tools like Gantt charts to drive project success.
By utilising these resources, you can enhance your project management skills, improve your proficiency in using Gantt charts, and drive your projects towards success.
Conclusion: Streamlining project management with a Gantt chart
In conclusion, a Gantt chart is an indispensable tool in project management, providing clarity, structure, and a visual representation of tasks and their dependencies. From construction to software development, these charts have demonstrated their utility in managing complex projects, ensuring timely delivery and efficient resource allocation. With an array of software and tools available to create and manage Gantt charts, and an abundance of resources for learning their application, project managers can readily adopt this tool to streamline project processes. Ultimately, the use of Gantt charts can transform the daunting task of project management into an organised, manageable, and successful endeavour.

