
Lean Wiki
Design of Experiments: An Overview
The Design of Experiments, otherwise known as DOE, is a statistical approach used to identify the factors that impact the

The Design of Experiments, otherwise known as DOE, is a statistical approach used to identify the factors that impact the

A fishbone diagram, also known as a cause and effect diagram or Ishikawa diagram, is a visualisation tool used to

As a project manager, part of your job is to lead change management. But what does that mean, exactly? And

What does DPMO Stand For? DPMO literally means, defects per million opportunities. It is a vital metric in quality management

In summary, dot plots offer a versatile and straightforward method for visualising data. They are

When analyzing data, it’s important to understand the distribution of the

In today’s business world, the cost of poor quality is more important than ever. With businesses operating in an increasingly

Correlation and Regression Analysis: Correlation and regression analysis are essential tools in statistical analysis. Put simply, correlation measures the relationship

A control plan in LSS, or Lean Six Sigma, is a document

Lean Six Sigma is a problem-solving approach that can be used to improve performance
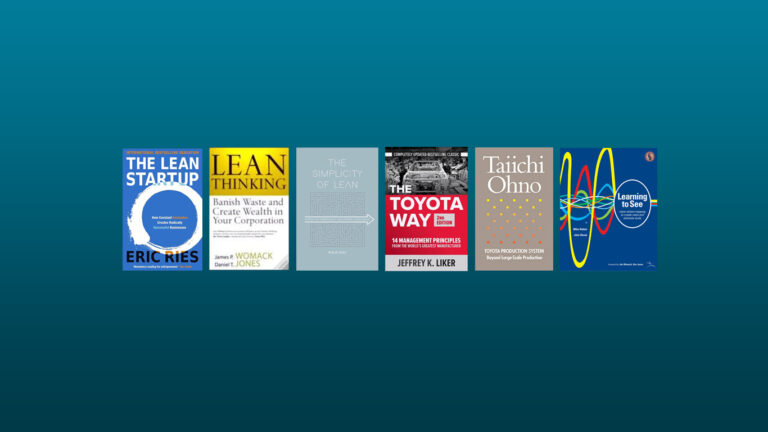
Our selection of the best books about Lean. We continually delve into the world of Lean but finding

Jidoka is an integral part of Lean principles that focuses on optimizing the flow of production processes. It plays a

Finding the best Lean Six Sigma Certification program can be quite a daunting task at first but it is not

Are you looking for a way to increase the productivity of your business? By applying Lean principles to workplace organisation,

Many executives face the challenge of knowing that there is a problem, but their organization lacks the talent or numbers

“Make a continuous process flow to surface issues” A great example of the difference between batch and lean flow is

The Pull Principle embodies the philosophy of producing only what is necessary, when it is necessary, and in the amount

Heijunka, a cornerstone concept in the Lean Six Sigma methodology, centres around the idea of levelling production to create a

The Design of Experiments, otherwise known as DOE, is a statistical approach used to identify the factors that impact the


A fishbone diagram, also known as a cause and effect diagram or Ishikawa diagram, is a visualisation tool used to

As a project manager, part of your job is to lead change management. But what does that mean, exactly? And

What does DPMO Stand For? DPMO literally means, defects per million opportunities. It is a vital metric in quality management

In summary, dot plots offer a versatile and straightforward method for visualising data. They are particularly useful for comparing distributions, analysing relationships between variables, and identifying patterns within datasets. The simplicity of creating a dot plot—drawing lines and placing dots accordingly—makes it an accessible tool for both beginners and experienced analysts. With practice, dot plots can be employed to create compelling visualizations that reveal insightful aspects of the data being examined.

When analyzing data, it’s important to understand the distribution of the data. The distribution refers to how the data is spread out or clustered around certain values or ranges. By examining the distribution, we can gain insights into the characteristics and patterns of the data, which can be useful in making informed decisions and predictions. There are various types of data distributions, each with its own unique properties and implications. Understanding these distributions is a fundamental aspect of data analysis and can help us make more accurate and meaningful interpretations of the data.

In today’s business world, the cost of poor quality is more important than ever. With businesses operating in an increasingly

Correlation and Regression Analysis: Correlation and regression analysis are essential tools in statistical analysis. Put simply, correlation measures the relationship

A control plan in LSS, or Lean Six Sigma, is a document that outlines the steps to be taken to ensure that a process is operating within acceptable limits. It helps to minimize variation in the process and maintain quality standards. The control plan typically includes details on the process steps, the metrics to be measured, and the actions to be taken when a deviation from the expected outcomes is identified. By implementing a control plan, organizations can achieve consistent results and reduce the risk of defects or errors in their processes.
Lean Six Sigma is a problem-solving approach that can be used to improve performance
Our selection of the best books about Lean. We continually delve into the world of Lean but finding
Jidoka is an integral part of Lean principles that focuses on optimizing the flow of production processes. It plays a
Finding the best Lean Six Sigma Certification program can be quite a daunting task at first but it is not
Are you looking for a way to increase the productivity of your business? By applying Lean principles to workplace organisation,
Many executives face the challenge of knowing that there is a problem, but their organization lacks the talent or numbers
“Make a continuous process flow to surface issues” A great example of the difference between batch and lean flow is
The Pull Principle embodies the philosophy of producing only what is necessary, when it is necessary, and in the amount
Heijunka, a cornerstone concept in the Lean Six Sigma methodology, centres around the idea of levelling production to create a